Table of Contents
Measure of Model Performance
Distance Matrix and Confusion matrix are two measures of Model performance
Distance Matrix
A distance matrix is a square matrix that contains the distances between each pair of points in a dataset.
It is used in machine learning for below models
- Clustering Algorithms: Algorithms like K-Means use distance matrices to group similar data points together.
- Nearest-Neighbor Methods: In K-Nearest Neighbors (KNN) classification or regression, the distance matrix is used to find the closest data points to a given query point.
Common Distance Matrix used
Euclidean Distance: The straight-line distance between two points in Euclidean space.

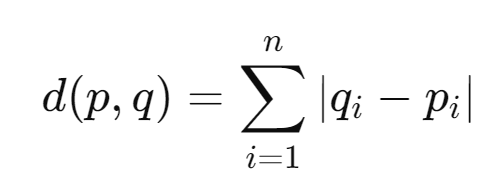
Manhattan Distance: The sum of the absolute differences of their Cartesian coordinates.

Distance Matrix Example
Let’s us understand Distance matrix with an example
| Points | Coordinate X | Coordinate Y |
| Point A | 1 | 2 |
| Point B | 4 | 6 |
| Point C | 5 | 2 |
Distance Matrix using Euclidean Distance formula

| Points | A | B | C |
| A | 0 | 5 | 4 |
| B | 5 | 0 | 4.1231 |
| C | 4 | 4.1231 | 0 |
d(A, B) =
d(A, B) =
d(A, B) = = 5
Observations
- A and B are separated by a distance of 5 units.
- A and C are closer, with a distance of 4 units.
- B and C are approximately 4.1231 units apart.
Use in Algorithms
Clustering Algorithms
- Cluster 1: Contains Points A and C as these are closest to each other
- Cluster 2: Contains Point B
Use in KNN algorithm
- New Point D at (2, 3). Compute distances 𝑑(𝐴𝐷), d(BD) and 𝑑(𝐶𝐷)
- Use these distances to find the nearest neighbors for classification or regression.
Confusion Matrix
Confusion Matrix definition
A Confusion Matrix is a table which describe the performance of a classification model on a set of test data for which the true values are known. It allows us to see where the model is getting confused between classes.
Definition: A matrix that compares actual target values with those predicted by the model.
2X2 Confusion Matrix
| Actual / Predicted Values | Positive | Negative |
| Positive | True Positive (TP) | False Negative (FN) |
| Negative | False Positive (FP) | True Negative (TN) |
- True Positive (TP): Correctly predicted positive class
- True Negative (TN): Correctly predicted negative class
- False Positive (FP): Incorrectly predicted positive class
- False Negative (FN): Incorrectly predicted negative class
Confusion Matrix Example
An Example of Confusion matrix- Use in medical test to detect a disease
Suppose we have a test dataset of 100 patients with the following actual conditions:
- Actual Positive Cases (Disease Present): 40 patients
- Actual Negative Cases (Disease Absent): 60 patients
We run our classification model on this test dataset, we obtain the following predictions:
- Predicted Positive Cases: 50 patients
- Correctly Predicted Positive Cases (True Positives, TP): 35 patients
- Incorrectly Predicted Positive Cases (False Positives, FP): 15 patients
- Predicted Negative Cases: 50 patients
- Correctly Predicted Negative Cases (True Negatives, TN): 45 patients
- Incorrectly Predicted Negative Cases (False Negatives, FN): 5 patients
Confusion Matrix for above example
| Actual / Predicted Values | Positive | Negative |
| Positive: 35(TP) + 5(FN) = 40 | TP=35 | FN=5 |
| Negative: 15(FP) + 45(TN) = 60 | FP=15 | TN = 45 |
Interpreting the Confusion Matrix
- True Positive (TP): The model correctly predicts that the patient has the disease.
- True Negative (TN): The model correctly predicts that the patient does not have the disease.
- False Positive (FP): The model incorrectly predicts that the patient has the disease (false alarm).
- False Negative (FN): The model incorrectly predicts that the patient does not have the disease (missed detection)
Calculating Performance Metrics
Accuracy
Definition : The proportion of correctly classified instances among all instances.
Formula = (TP+TN) / (TP+TN+FP+FN)
- (35+45) / (100) = 80%
Precision (Positive Predictive Value)
Definition: The proportion of positive identifications that were correctly predicted
Formula = (TP) / {TP + FP(Incorrectly predicted positive cases)}
- 35 / (35+15) = 70%
Recall (True Positive Rate)
Definition: Percentage of actual positive correctly identified
Formula = TP / {TP+FN (actually positive, incorrectly predicted as negative)}
- 35 / (35+5) = 87.5%
Specificity (True Negative Rate)
Definition: The proportion of actual negatives that were correctly identified.
Formula = TN / {(TN + FP (Actually negative, incorrectly predicted as positive)}
- 45 / (45 + 15) = 75%
F1 Score
Definition: Harmonic Mean of precision and recall. Harmonic mean is used instead of the arithmetic mean because it gives more weight to the lower of the two values (precision or recall)
Formula = 2(Precision x Recall)/ (Precision + Recall)
- 2x (.7*.875)/1.575 = 78%
Interpretation: The F1 Score balances precision and recall, providing a single metric to evaluate the model’s performance.
False Positive Rate (FPR)
Definition: The proportion of negatives incorrectly classified as positive.
Formula = FP / (FP+TN)
- 15 / (15+45) = 25%
False Negative Rate (FNR)
Definition: The proportion of positives incorrectly classified as negative.
Formula = FN / (FN + TP)
- 5 / (5+35) = 12.5%
Interpreting the Metrics
- High Recall (Sensitivity): The model is good at identifying actual positives. It has correctly identified 87.5% of the patients who have the disease.
- Moderate Precision: Out of all positive predictions, only 70% were correct. There is a significant number of false positives (15 out of 50 predicted positives).